K-12 Virtual Education
Virtual schools (also known as cyber and online learning) are full-time online schools which do not serve students at a physical facility. Teachers and students are geographically remote from one another, and all or most of the instruction is provided online. These may be virtual charter schools or non-charter virtual schools. Online schools typically are responsible for ensuring their students take state assessments, and for their students’ scores on those assessments.
An online course is a full course education experience in which instruction takes place primarily over the Internet, using an online delivery system to provide access to course content. It may be accessed from multiple settings (in school and/or out of school buildings). A certificated teacher is the teacher of record for the course.
A hybrid course is one where the majority of the learning and instruction takes place online, with the student and teacher separated geographically, but still includes some traditional face-to-face “seat time.” In hybrid online courses the online instructor remains the teacher of record even though the student spends time with additional educators (see: Keeping Pace with K-12 Online Learning report – 2015). (Kpk12)
According to the National Education Policy Center (NEPC), http://nepc.colorado.edu/publication/virtual-schools-annual-2016, full-time virtual schools deliver all curriculum and instruction via the Internet and electronic communication, usually asynchronously with students at home and teachers at a remote location. Blended schools combine traditional face-to-face instruction in classrooms with virtual instruction (see: Blended Learning Overview).
The use of virtual learning in the K-12 environment in the United States began with the private Laurel Springs School around 1991, followed in 1994 by the first supplemental virtual school, the Utah Electronic High School, and the first cyber charter school, Choice 2000 in California. Since then, the center of activity and growth has moved from state-level organizations, such as state virtual schools and online charter schools drawing students across entire states, to individual districts and schools.
It has also moved from being mostly online to frequently combining online and onsite component known as blended-based learning. Most students accessing online courses or content are doing so from a physical school or some other formal learning center, not from home. The number of courses using online content in which the teacher of record is based at the physical school dwarfs the number of courses in which the teacher is online.
The growth of online education in postsecondary and professional development contributed to the legitimacy and growth of virtual learning in K–12. Early forms of online learning initially centered on translating a complete classroom course syllabus to a distance education  environment, including similar content and assignments, and then grew to allow for teacher-student interactions, also similar to a traditional classroom. Examples of this type of early online learning program were often created in rural states such as Alaska, North Dakota and Nebraska. Online schools have innovated in a variety of ways, but in most cases they remain based on teacher-student interaction, and in some cases student-student interaction. Because online courses often serve as an alternative to regular classroom instruction, and in some cases draw students out of traditional schools, education policy and oversight provisions have evolved to address online learning (Kpk12).
With the development of online courses to supplement student learning in the late 1990’s, national and state-level suppliers – vendors, state virtual schools, regional service agencies, and others – began providing schools and districts with online courses and technology. Schools had long been using media resources and technology in the classroom, but online learning emerged as a solution to meet specific school challenges and student needs, including providing:
- Alternatives for scheduling conflicts
- Highly qualified teachers in subjects where teachers were not available, particularly Advanced Placement
- Access to hard to find courses, especially in rural or inner-city schools
- Electives and other accelerated options for college bound students
- Flexibility for athletes, homebound students, those in the arts, dropouts, and pregnant or incarcerated students
- Credit recovery programs for at-risk students
- Solutions for small class sizes and emergency shortfalls in teachers
Private schools are a much smaller segment than public schools. The usage of virtual learning in private schools is generally lower than in public schools, but the use of supplemental virtual courses is growing. In some states, private school students have access to publicly funded online options on a limited basis; these may be used by students separately from their private school.
Homeschooled students use a variety of online resources that they procure, including courses that combine online delivery with curriculum shipped to students. Faith-based suppliers often provide these. In some states homeschooled students also have access to publicly funded supplemental online courses and full-time online schools. As homeschooled students take some publicly funded online courses or attend online public schools, the lines between homeschool and public school are blurring (Kpk12).
Who’s Who in Virtual Relationships
Confusion exists between entities that are schools – those that enroll students and provide a full range of courses and associated services – and those that are suppliers of online courses, tools, and teaching, to schools and also to families who are buying courses and instructional materials. This confusion has been exacerbated by the fact that suppliers may be companies, nonprofit organizations, or public agencies, and that some suppliers have the word “school” or “academy” in their name. Second, some entities are suppliers and also own and operate schools. Finally, in some school districts the line between school and supplier becomes blurred, because the district runs a program that serves its students directly, but that program, often with a name that sounds like a school, is actually an internal school district services function that delivers online courses to students across district schools (Kpk12).
Understanding the layers and their relationships in the universe of suppliers and users is critical for comprehending the digital learning landscape. For online and digital learning, suppliers are entities that provide online and digital learning products and services to schools, and sometimes directly to students, but usually coordinated and monitored by a school. A supplier is not responsible for a student’s academic activity and performance and is not authorized to do so. They do not own the transcript of a student, administer state assessments, assign grade levels, or offer diplomas (Kpk12).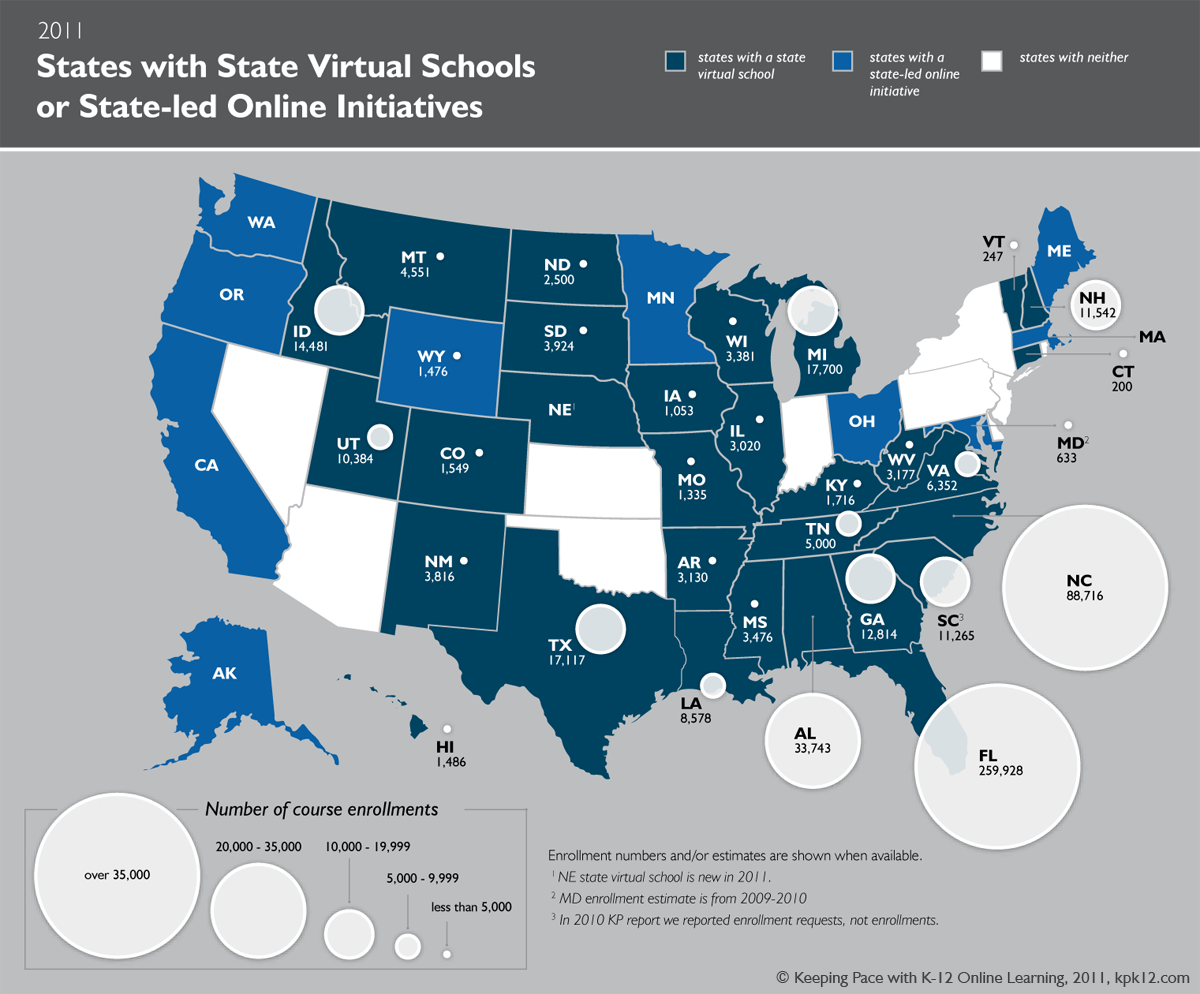
Some suppliers, such as state virtual schools, offer courses using teachers employed by the state virtual school, but it is the student’s home school that maintains responsibility. The supplier, offering the online course and perhaps the teacher, is essentially a contracted outsource provider of instructional services to a school. Schools, on the other hand, are entities, authorized via state policy, that have the primary responsibility for a student’s education. Schools include traditional public, charter, and private schools; independent study and similar non-traditional schools that enroll students; and online, onsite, and blended schools. Only authorized schools can grant credit towards grade level advancement and confer diplomas (Kpk12).
State virtual schools are intermediate supplier organizations that deliver online courses, instruction and other online learning services to schools and districts across the states in which they operate. State virtual schools are usually created by legislation or by a state-level agency, employ staff, and receive state appropriation or grant funding for the purpose of providing online learning opportunities to students across the state. They also may charge course fees to help cover costs. The organizations may be administered by a state education agency, but may also be 501(c)(3) nonprofits, charter schools, or organizations contracted to operate the state virtual school by the state agency (Kpk12).
Regional service agencies (RSA) are “public entities created by state statute, to provide educational support programs and services to local schools and school districts within a given geographic area” (Association of Educational Service Agencies). RSAs function as a level of education agency between the district and state. Regional service agencies go by many names, including intermediate school districts, Boards of Cooperative Educational Services (BOCES), intermediate units, educational service centers, Cooperative Education Service Agencies (CESA), county offices and others (Kpk12).
Virtual Education in Practice
Today many technologies can be, and are, used in virtual learning, from blogs, to collaborative software, and virtual classrooms. Most eLearning situations use combinations of these techniques. eLearning can make a big difference in education. Under the monitoring of their parents children can develop their knowledge, skills and perception of the world using the interactivity of the new media. Everyone must have a basic knowledge of technology and its use to function in modern society.
Technology kits are usually provided that include computers, printers, and reimbursement for home internet use. Students are to use technology for school use only and must meet weekly work submission requirements. Teachers employed by K–12 online public virtual schools must be certified teachers in the state they are teaching in. Virtual schools allow for students to maintain their own pacing and progress, course selection, and provide the flexibility for students to create their own schedule.
Virtual learning is increasingly being utilized by students who may not want to go to traditional schools due to severe allergies or other medical issues, fear of school violence and school bullying and students whose parents would like to homeschool but do not feel qualified. Some students are engaged in a time-consuming pursuit such as arts or sports, or have not been academically successful in a physical school and are seeking a different mode of instruction. Virtual schools create a safe haven for students to receive a quality education while almost completely avoiding these common problems.
Virtual charter schools also often are not limited by location, income level or class size in the way traditional public schools are and enroll students from across entire states. However, a growing number of virtual charter schools are being run by districts or regional service agencies that enroll students from within a defined boundary.
The more established virtual charter schools offer students a full range of supplemental programs which not only enhance the curriculum choices that are offered, but they also provide support for students so that they can become as successful as possible in an online environment. Some of these supplemental programs include Student Assistance Programs (SAP) for students who may be struggling with other areas in their life and not just academics.
Millions of students are taking supplemental online courses while attending a physical school. Many of these are recovering credits. Others are taking advanced, honors, or dual enrollment online courses that are not available as traditional courses. Still others are taking courses that are offered at their physical school, but are taking them online in an extra period, or over the summer, in order to gain scheduling flexibility.
The extent to which the student’s enrolling school supports the online courses varies. In some schools the student is supported with a room, computer, and mentor. At the other end of the spectrum, some students take the online courses from home with no support from the physical school. However, it is known that student success in online courses correlates with local school support.
An unknown number of students are attending hybrid schools that combine a significant amount of online instruction with a significant amount of face-to-face instruction with a teacher or mentor. The same companies supporting full-time online schools run some of these hybrid schools. Other hybrid schools have their roots in alternative education programs that preceded the spread of online courses. These schools often serve students who are at risk of dropping out, or have dropped out of a traditional school and returned to public education via the alternative program.
Online virtual schools, like Study Island (see: K-12 Online Vendors) offer open tutoring services to provide for those students that require extra support and guidance counseling. Other programs include Title-1 reading; gifted education; special education; virtual field trips to enhance socialization in a cyber-environment; student help to prepare for state testing by improving math and reading skills; and Early College Scholarships. Students are also assigned to a supervisor shortly after enrollment. This supervisor is the main point of contact initially, and acts in an advisory capacity to support students throughout their online education. They monitor student progress and act as liaisons for students, families, staff, and administration to provide continuous communication and guidance.
National private schools are also available online. These provide the benefits of virtual learning to students in states where charter virtual schools are not available. They also may allow students greater flexibility and exemption from state testing.
Competency-based learning
Since virtual learning allows students to advance at their own pace, Competency-based learning has become a hallmark of virtual education. This teaching and learning platform allows students to advance upon mastery of course content. Competency-based education is based on competencies that include explicit, measurable, transferable learning objectives that empower students. Assessment is meaningful. Students receive timely, differentiated support based on their individual learning needs. Learning outcomes emphasize competencies that include application and creation of knowledge along with the development of important skills and dispositions. (iNACOL, 2013)
Technology and Apps in Virtual Education
Teachers are using digital tools and resources – most of which are online – in their classrooms (see: eLearning Technology in the Classroom). These items include the use of websites; Google Apps for Education; countless other software applications for math, reading, and other subjects; classroom management software and learning management systems (see: Learning Management Systems); and computers, clickers, interactive whiteboards, and other technology products in physical classrooms.
The most successful of these educational applications of technology have changed school models and instructional practices. Many of them have an onsite component as well, meaning that they fit the most commonly used definition of blended learning. Traditional public schools represent by far the largest sector of K–12 education, and as such they are the largest user of online learning. Nearly all school districts are using online learning at some level. Most of this usage is of supplemental online courses, with smaller numbers of students in hybrid and fully online schools (Kpk12). There is, however, continuing debate on how effective ed tech is on improving test scores (see: Ed Tech & Test Scores).
State Virtual Schools
State virtual schools (SVS) are an important part of the online learning landscape, serving over 460,000 students who took more than 815,000 supplemental online courses in 24 states in SY 2014–15. As a group, they are one of the largest and most recognized intermediate suppliers to schools, delivering online courses, instruction, technology infrastructure and other online learning related services to schools and districts across the states in which they operate. State virtual schools are operational intermediate supplier organizations that provide online learning programs to schools statewide.
State virtual schools were created by legislation or by state level agencies, usually funded in part or entirely by a state appropriation or grant. State virtual schools are not actually “schools” in the traditional sense. They supply online courses and related services to schools. With the exception of state virtual schools in states with course access policies, students are usually enrolled with district approval. Even then the school or district plays an integral role in counseling and enrolling students in the state virtual school. State virtual schools can be administered by a state education agency but can also be separate nonprofit organizations, charter schools, higher education institutions and even regional service agencies contracted by the state education agency to operate the state virtual school(Kpk12).
A Look at Virtual School Funding
From the beginning state virtual schools have been primarily funded at the state level, through direct legislative action or via a major state agency like the state department of education. In many cases 100% of all funding necessary to operate and deliver courses and services is provided via state level funding. In some cases however, state funding provides for a portion of costs, and the state virtual schools (SVS) is required to recover remaining costs through course fees to schools, sometimes augmented with grants and other revenues. In a very few instances, there is no state level funding and all revenues must come from course fees, grants and other sources.
Although funding is often perceived as an issue separate from accountability, funding and accountability are tied together in many ways. In particular, issues of student mobility are exacerbated when funding is based on a limited number of count days. School funding methodologies vary by state. Most states broadly use one of the following funding calculation methods:
- Single count day: Students are counted on a single day each year.
- Multiple count days or count period: Students are counted on a single day or short periods during multiple times throughout the year.
- Average daily attendance (ADA): Students are counted based on the average actual daily attendance.
- Average daily membership (ADM): Students are counted based on the average actual daily enrollment.
- Achievement-based: Funding is based on demonstrated achievement metrics of student outcomes.
A predictable relationship exists between these funding schemes and accountability methodology. A single annual count day is the least desirable for both funding and accountability effectiveness, whereas the achievement-based model is the most effective and equitable for both funding and accountability. States would improve their funding mechanisms by moving up and to the right along the continuum, and in doing so would alleviate some of the ways in which poor funding mechanisms exacerbate student mobility issues. (KpK12)
State Virtual School Budgets
As a group the 24 states with virtual schools is spending gets $300 million to deliver online learning and related products and services. This is less than one percent of the group states’s education budgets. At $178 million Florida spends more that the other 23 states combined. About a third of the state virtual schools spend less that $1 million annually with the average cost per online course enrollment at $370.
Since almost all online courses delivered by state virtual schools are teacher-led, the primary factor in determining budget requirements, and largest single portion of the budget, is teacher compensation. Virtual schools that have large numbers of enrollments typically employ full-time teachers for all or most of their teaching needs. In these cases, it is typical that teachers are paid in a similar way and on similar scales as teachers in the schools in their state. Part-time or adjunct teachers—a significant percentage of teachers for state virtual schools—are typically paid on a per enrollment basis, generally ranging from about $140 to over $200 per enrollment based on factors such as experience and type of course.
Florida Virtual School (FLVS) is the largest state virtual school in the country, accounting for over 2 million course completions since it opened in 1997. In 2014–15, enrollments in one-semester supplemental online courses in Florida, including FLVS and a variety of district programs, exceeded 520,000 course completions. Students taking all of their courses online reached about 11,000.
FLVS is one of only two state virtual schools in the country (out of 24) to be funded based on course completion.
The District Virtual Instruction Program (VIP) and virtual charter schools are funded through the Florida Education Finance Program (FEFP) when a student successfully completes a course.![]()
Districts receive FEFP funding for each student and may operate their own programs, or they may negotiate with their virtual instruction providers for rates below the per-pupil funding. Completions are defined as earning passing grades or credits for online courses or the prescribed level of content that counts toward promotion to the next grade.
Per-student base funding for virtual programs in 2015–16 was $5,230 per full-time virtual education student completion; this equates to less than $5,230 per student when taking into account students who do not complete. If a student takes six courses, then the per-course completion funding will remain at $435.83. However, a student’s FTE is prorated based on the total number of courses, which can be more than six, and therefore less than per course completion rate. FLVS received an estimated $162 million in funding in 2014–15. FLVS FT is eligible for categorical funding in addition to basic education funding, including exceptional student education (ESE) and English for speakers of other languages (ESOL).
Some Virtual Education Numbers
As of 2015 there were 50.1 million students attending 98,817 public schools; 2.9 million students attending 6,700 charter schools (5.7%); 4.9 million students attending 30,861 private schools; and 1.8 million students being home schooled (Kpk12).
In 2013-14, 447 full-time virtual schools enrolled close to 262,000 students. Eighty-seven blended schools enrolled 26,155 students. Thirty-three states had full-time virtual schools and 16 states had blended schools. There were two states that had blended but not full-time virtual schools (New Jersey and Rhode Island) (NEPC).
Although only 44.4% of the full-time virtual schools were operated by private education management organizations (EMOs) (see: K-12 Virtual For-Profit Schools), they accounted for 74.4% of all enrollments. Virtual schools operated by for-profit EMOs enrolled an average 1,027 students. In contrast, those operated by non-profit EMOs enrolled an average 286 students, and public virtual schools operating independently enrolled an average 266 students (NEPC).
Private EMOs are playing less of a role in the blended sector. Of blended schools, 62.8% are independent (involving no private EMO), while 20.9% are operated by non-profit EMOs and 16.3% are operated by for-profit EMOs. Generally, blended schools have fewer students per school than virtual schools. Blended schools enroll an average of 305 students, whereas virtual schools enroll an average of 577 students (NEPC).
Among the virtual schools in the inventory, 51.5% are charter schools; together they accounted for 82.6% of enrollment. School districts have been increasingly creating their own virtual schools, but these tend to enroll far fewer students. Blended schools are rather evenly split between district schools (47.7%) and charter schools (52.3%). However, the charter schools had substantially larger enrollments: blended charters enrolled an average of 409 students, while blended district schools enrolled an average of 191 students (NEPC).
Relative to national public school enrollment, virtual schools have substantially fewer minority students and fewer low-income students. In relation to national averages, blended schools have a similar proportion of low-income students, but a substantially higher average of Hispanic students. While the average student-teacher ratio in the nation’s public schools was 16 students per teacher, (1) blended schools reported more than twice as many students per teacher (32.4 students per teacher), and virtual schools reported more than twice as many students per teacher (35 students per teacher). Virtual schools operated by for-profit EMOs had the highest ratio (44 students per teacher), while those operated by nonprofit EMOs had the lowest (19.5 students per teacher).
Many of the students taking supplemental online courses are taking courses offered by state virtual schools. In 2014–15 state virtual schools in 24 states, representing 40% of the population of the United States, served over 462,000 students who took a total of 815,000 semester-long courses (Kpk12).
Six in ten public school students live in states that don’t have state virtual schools, and these students are taking supplemental online courses as well. It is estimate another 2.2 million students are taking a total of about 3.8 million online courses. These are mostly in addition to the state virtual school numbers. Together, they sum to about 4.5 million supplemental online course enrollments (kpk12).
Enrollment by Subject
Total enrollments per subject in this sample were 3,739,983 with 1.4 as the overall average number of courses taken by a student each semester and 1,335,708 the estimated number of unique students taking these courses. The following is a subject breakdown by subject, number of students and percentage comparison:
Core Subjects 73.9%
Other Areas 26.1%
Subject Students Percentage
Science 526,251 14.1%
Language Arts 863,418 23.1%
Math 850,335 22.7%
Social studies 523,550 14.0%
World languages 91,993 2.5%
Arts 26,673 0.7%
Electives / other 749,751 20.0%
Health/PE 108,012 2.9%
Charter schools make up less than 6% of total enrollments in the U.S., but full-time virtual charter schools accounted for the large majority of full-time online students and 3.3 million course enrollments. Numerous states have in place measures that hinder the growth of online charter schools, ranging from enrollment caps to additional reporting requirements to substantial funding cuts, but no state that has allowed online charter schools has subsequently eliminated them.
Virtual courses taken by grade level:
Full-time Virtual School Supplemental Courses
Grades K-5 26% 2%
Grades 6-8 28% 14%
Grades 9-12 46% 84%
Charter schools, particularly virtual charter schools (sometimes called cyber schools), enroll a much smaller percentage of students, but these full-time virtual charter students are usually taking between 6 to 14 online courses in a school year.
Public school students’ motivation for taking online courses bear out many of these school goals. Based on a national student survey, 47% of students in grades 9–12 pursue online learning to access courses not offered at the school, and 43% choose to take courses online to be able to work at their own pace. Forty-two percent of students in grades 6–8 cited the desire for extra help as the major reason for choosing an online course.
THE VIRTUAL HIGH SCHOOL
A nationwide consortium, The Virtual High School’s (VHS) unique structure and approach to working with member schools is often referred to as a collaborative. This nonprofit organization is most like a consortium supplier, where members share online instruction and content. In addition, members benefit from online course development, technology, teacher professional development and other online learning services provided by VHS. Although particularly strong in the Northeast (VHS partners with nearly 200 middle and high schools in Massachusetts with over 6,800 enrollments in the state), the Virtual High School is national in scope with members in 40 states and territories and an international presence with students in 33 countries. In SY 2014–15 10,525 students took online courses from VHS, totally 17,273 course enrollments. VHS has multiple options for school partnerships. Schools with Teaching Memberships designate a teacher to teach a VHS course and in return the school saves on membership fees. Student Only Membership schools may participate in VHS in a student “seat” model, with as few as two seats, and schools enjoy discounts based on the size of their membership. Consortium Memberships share seats and take advantage of a volume discount option for educational service agencies, state or district programs. Students may enroll directly with VHS at a cost of $450 per semester course. The VHS also offers a full-time program in which students may take their entire high school curriculum online through VHS, while still remaining students within their local school district. VHS has developed over 200 original online courses, including an innovative science course, Space Station Academy, that offers students a virtual trip to the International Space Station. Students work on real-world experiments with astronauts and receive feedback and facilitation from former space explorers. Space Station Academy combines STEM disciplines to create an engaging and interactive learning experience for middle and high school students.
Membership models and governance vary as widely as size and geographic reach. Some consortia limit their offerings to their members, but others extend their services to schools and districts outside the consortium. The Indiana Virtual Academy (IVA) is a consortium that was formed to provide online learning for students in the school districts in Ripley County. It discounts services for partner schools and residents of Ripley County ($190 per course), but enrolls students across the state at a cost of $295 per course, with around 3,500 annual course enrollments in SY 2014–15. The consortium is governed by a Board of Directors that consists of a regional career center, the director of a local community foundation, and the superintendents of the four school corporations in Ripley County. SUPERNet in Texas reaches beyond its regional membership to include some of its courses in the Texas Virtual School Network catalog that allow students from across the state to enroll in SUPERNet courses. SUPERNet develops all of its course content in-house using member district teachers. Members pay an annual fee to have access to all course offerings.
Problems in the Sector
Poor Performance
Because of digital technology these blended and virtual learning schools are expanding in K-12 education but not without problems and controversy. According to the National Education Policy Center (NEPC), virtual and blended schools continue to grow at a rapid pace in spite of weak academic outcomes (see School Performance Data below). The four-year graduation rate in 2014-15 was 40.6 percent for full-time virtual schools and 37.4 percent for blended schools, compared to 81 percent for the nation as a whole. In recent years, despite rising enrollment numbers, the cyber charter sector has come under scrutiny for poor performance and management. On several measures virtual and blended schools perform poorly when compared to traditional public schools, according to the new study.
Teach to One
For the 2016-17 school year the Mountain View CA., Whisman School District bought a $521,000 (including licensing & service fees) “smart” math curriculum called Teach to One that is administered almost entirely on computers by using algorithms to tailor lessons to individual students. Under the terms of the contract the provider, New Classrooms, would provide the math platform, instructional content, program schedules and assessments, and the district would provide the teaching staff, the laptops and other required technology to run the program.
Since the program’s launch, however, parents have voiced major concerns that the curriculum is a haphazard mess, jumping between remedial math and overly challenging course content, and that the primary role of the math teacher has been relegated to managing the program rather than to providing direct instruction. Students use two of three teaching styles — teacher instruction, group activities and independent work — and end math class with what’s called an “exit ticket,” or daily quiz, to see how well they understood the day’s lessons. (see: Teach to One Grows).
The quiz results determine what lessons each student will get the next day. But when parents started reviewing daily lessons to see what their kids were learning, many were troubled by what they called incoherent, poorly constructed content. Worse yet, some parents say their sixth-grade children have become so frustrated and unhappy with math under Teach to One, that they are turned off to the subject entirely because of the pilot program. The school district has since shelved the program and has gone back to teacher instruction. Click Mountain View Voice to read the entire article and stakeholder comments.
Inflated Attendance & Fraud
Several for-profit virtual charter schools have been indicted by state regulatory agencies. K-12, inc. was fined a massive $165 million for alleged violations of misrepresenting attendance figures, false claims, false advertising and unfair competition laws. (see: K-12, inc. fined by California). In Ohio 9 virtual charter schools could have to repay $80 million for over stating attendance. And in Michigan the founder of Grand Traverse Academy was sentenced to 41 months in prison for fraud and income tax evasion. Carol Burris’ first article in a four part series on California’s charter schools How messed up is California’s charter sector? You won’t believe how much is worth a read.
School Performance Data
The school performance data available from state education agencies is used to draw broad pictures of overall school performance across virtual and blended learning schools. The best evidence is coming from states that have replaced Adequate Yearly Progress (AYP) with broader measures; as noted below, the virtual and blended schools do not do well. But even these newer approaches by states to rate the performance of their schools have limitations. The performance data discussed below, therefore, should be understood as red flags rather than as causal statements about quality.
- Multiple or expanded measures of school performance reveal that virtual school outcomes continued to lag significantly behind that of traditional brick-and-mortar schools. Blended schools tended to score even lower on performance measures than virtual schools, although this may be influenced by the fact that blended schools serve substantially more low-income students.
- Three states with virtual schools continue to use AYP to indicate whether or not schools meet state standards. Most virtual schools in these states did not report AYP results; of those that did, only a few met AYP targets.
- Most states have, however, replaced AYP measures with some sort of school performance ratings or scores. These have typically been based on a variety of measures combined to produce an overall evaluation of school performance. Among the 62 virtual schools with ratings in 2014-15, 19 (30.6%) were rated acceptable. Independent virtual schools (not operated by EMOs) were more likely to receive an acceptable rating than virtual schools operated by these private EMOs: 40.7% compared with 23.5%.
- Another measure of virtual school performance was produced by comparing student performance on assessments in English Language Arts (ELA) and Mathematics in individual virtual schools with state averages. Of the 121 virtual schools for which data were available, 22 (18.2%) had proficiency rates above the state average; 82 percent had proficiency rates below state averages. In independent virtual schools as well as virtual schools operated by for-profit EMOs, were only 16.7% and 14.3%, respectively, had proficiency rates above state averages. Of ten virtual schools operated by nonprofit EMOs, five (50%) had proficiency rates above state averages.
- Five out of 22 independent blended schools (22.7%) had a higher percentage of students rated proficient than the state percentage. District virtual schools were more likely to receive an acceptable rating than charter virtual schools: 37.8% compared with 20.0%. Similarly, 23.1% of district virtual schools had proficiency rates above the state average, while 16.8% of charter virtual schools had above average rates. District run blended schools also had higher proficiency rates (27.3%) than charter blended schools (9.7%).
- As schools transitioned from the adequate yearly progress (AYP) measure to multiple performance measures under ESEA flexibility waivers, performance outcomes continued to differ in charter virtual schools, district virtual schools, and blended schools.
- The evidence on graduation rates aligns with findings from school performance measures, contributing to the overall picture of school performance. Only 131 virtual schools and 26 blended schools had data specific to on-time graduation in 2013-14. The on-time graduation rate (or four-year graduation rate) for full-time virtual schools and blended schools was half the national average: 40.6% for virtual schools, 37.4% for blended schools, and 81.0% for the nation as a whole. The graduation rates for virtual schools have worsened by 3 percentage points over the past few years, even as graduation rates in the country have been improving about 1 percentage point each year.
As detailed below, the findings outlined in this report align with reports from state auditors and new national studies by other organizations, including a recent set of studies funded by the Walton Foundation.
Recommendations
Given the rapid growth of virtual schools and blended schools, the populations they serve, and their relatively poor outcomes on widely used accountability measures, it is recommended that:
- Policymakers slow or stop the growth in the number of virtual schools and blended schools and the size of their enrollments until the reasons for their relatively poor outcomes (2) have been identified and addressed. States should place their first priority on understanding why virtual schools and blended schools perform weakly under a college- and career-ready accountability system and how their performance can be improved before undertaking any measures to expand these relatively new models of schooling.
- Oversight authorities specify and enforce sanctions for virtual schools and blended schools if they fail to demonstrate that they are doing a good job with their students.
- Policymakers require virtual schools and blended schools to devote more resources to instruction, particularly by specifying a maximum ratio of students to teachers.
- State agencies ensure that virtual schools and blended schools fully report data related to the population of students they serve and the teachers they employ.
- State and federal policymakers promote efforts to design new outcome measures appropriate to the unique characteristics of full-time virtual schools and blended schools. Passage of the Every Student Succeeds Act (ESSA) represents an opportunity for those states with a growing virtual and blended school sector to improve upon their accountability systems for reporting data on school performance measures.
- Policymakers and other stakeholders support more research to identify which policy options—especially those impacting funding and accountability mechanisms— are most likely to promote successful virtual schools and blended schools. The virtual school sector, while experiencing considerable growth in recent years, is still in need of rigorous study to determine their impact on the instructional needs of diverse students. More research is also needed to increase understanding of the inner workings of virtual and blended schools, including such factors as the curriculum and the nature of student-teacher interactions. Such research should help identify and remedy features that are negatively affecting student learning.
- This finding is based on NCES data from the Conditions of Education 2015. Retrieved December 2, 2015 from http://nces.ed.gov/pubs2015/2015144_highlights.pdf and http://nces.ed.gov/programs/coe/indicator_clr. asp
- Although there are many uses for the information generated by outcome measurement, here we confine ourselves only to “measured outcomes” as opposed to the “effect of the virtual schools/blended schools on measured outcomes.” The latter focuses on causal inferences which would require considerable time and resources in order to gather and analyze the data. Our analytic approach is more pragmatic—that is, to raise performance flags for virtual schools and blended schools that are failing to meet performance targets for the state. The challenge now facing the virtual school sector is to maximize its desirable effects and minimize the undesirable ones. The challenge is made tougher by the fact that the data are still coming in. While measured, outcomes reported here cannot directly speak to causality, our analysis represents an improvement over single-state studies. Our results have important implications for the ongoing debate over whether virtual schools and blended schools that repeatedly fail to meet state standards should face sanctions or shut down. Although the state ratings and the performance measures we use are limited, it is important to recognize that ALL measures of performance are negative for the group of virtual and blended learning schools. There are noteworthy state-by-state differences (see Appendix D). Further exploration of the academic impact of virtual schools and blended schools should be high on the list of priorities for those interested in these types of schools. Future research on the virtual school sector should also seek to examine a broader and deeper range of student outcomes (non-cognitive impacts).
Recent Comments